IBM Cloud
Warning
Note Only study this section if you are development on an OpenShift Development environment that is managed on IBM Cloud. If you are on AWS or Azure go to the OpenShift Monitoring content
In IBM Garage Method, one of the Operate practices is to automate application monitoring. Sysdig automates application monitoring, enabling an operator to view stats and collect metrics about a Kubernetes cluster and its deployments. OpenShift's development environment includes an IBM Cloud Monitoring with Sysdig service instance configured with a Sysdig agent installed in the environment's cluster. Simply by deploying your application into the OpenShift development environment, Sysdig monitors it.
- Open the Sysdig web UI by navigating to the OpenShift web console and click on 9 squares icon. It gives a list of the developer tools.
- Select SysDig and navigate to SysDig UI.
Sysdig Monitoring
IBM Cloud Monitoring with Sysdig explains how to configure and use an instance of the Sysdig service, but the OpenShift development env has already done most of this for you. You can skip steps 1-3 about user access, provisioning an instance, and installing an agent.
Sysdig dashboard
Open the Sysdig web UI for your environment's cluster - Step 4: Launch the web UI explains how to open the web UI - In the IBM Cloud dashboard, navigate to Observability > Monitoring - Find the monitoring instance named after your environment's cluster, such as showcase-dev-iks-sysdig  - In the monitoring instance, press the View Sysdig button to open the Sysdig web UI
Explore your application
By default, the Sysdig dashboard opens the Explore page on its Deployments and Pods grouping.
- Select your cluster
By default, Sysdig opens its Overview by Process dashboard, which has panels showing stats about CPU, memory, and networking. This is one of Sysdig's Default Dashboards (i.e. built-in dashboards).
These are the cumulative totals for all the pods running in the cluster. Hover over a graph and a key pops up to list the pods and show each one's color.
- Expand your cluster and namespace, then select your deployment
This shows the stats for just the pods in your deployment.
On the Dashboard page, you can create your own custom dashboards.
Step 5: Monitor your environment of the Getting started tutorial gives some instructions on monitoring, managing, and what to do next.
Give it a try
Before you begin to monitor your application instances, make sure that you have deployed an app into your development cluster. This Give it a Try uses template-node-typescript as an example.
The SysDig service is already created, bound and configured to listen to monitoring metrics and events for your development cluster. You can see this in the HTTP overview.
- Open the SysDig instance that is named the same as your development cluster.
- Go to Dashboards > Default Dashboards > Applications > HTTP
The dashboard shows stats for all incoming HTTP requests for all apps in the cluster. Browse through these views to get a feel for what they're showing.
View your app's metrics
Take a look at the metrics for your app.
- Select the Explore page in the left nav menu
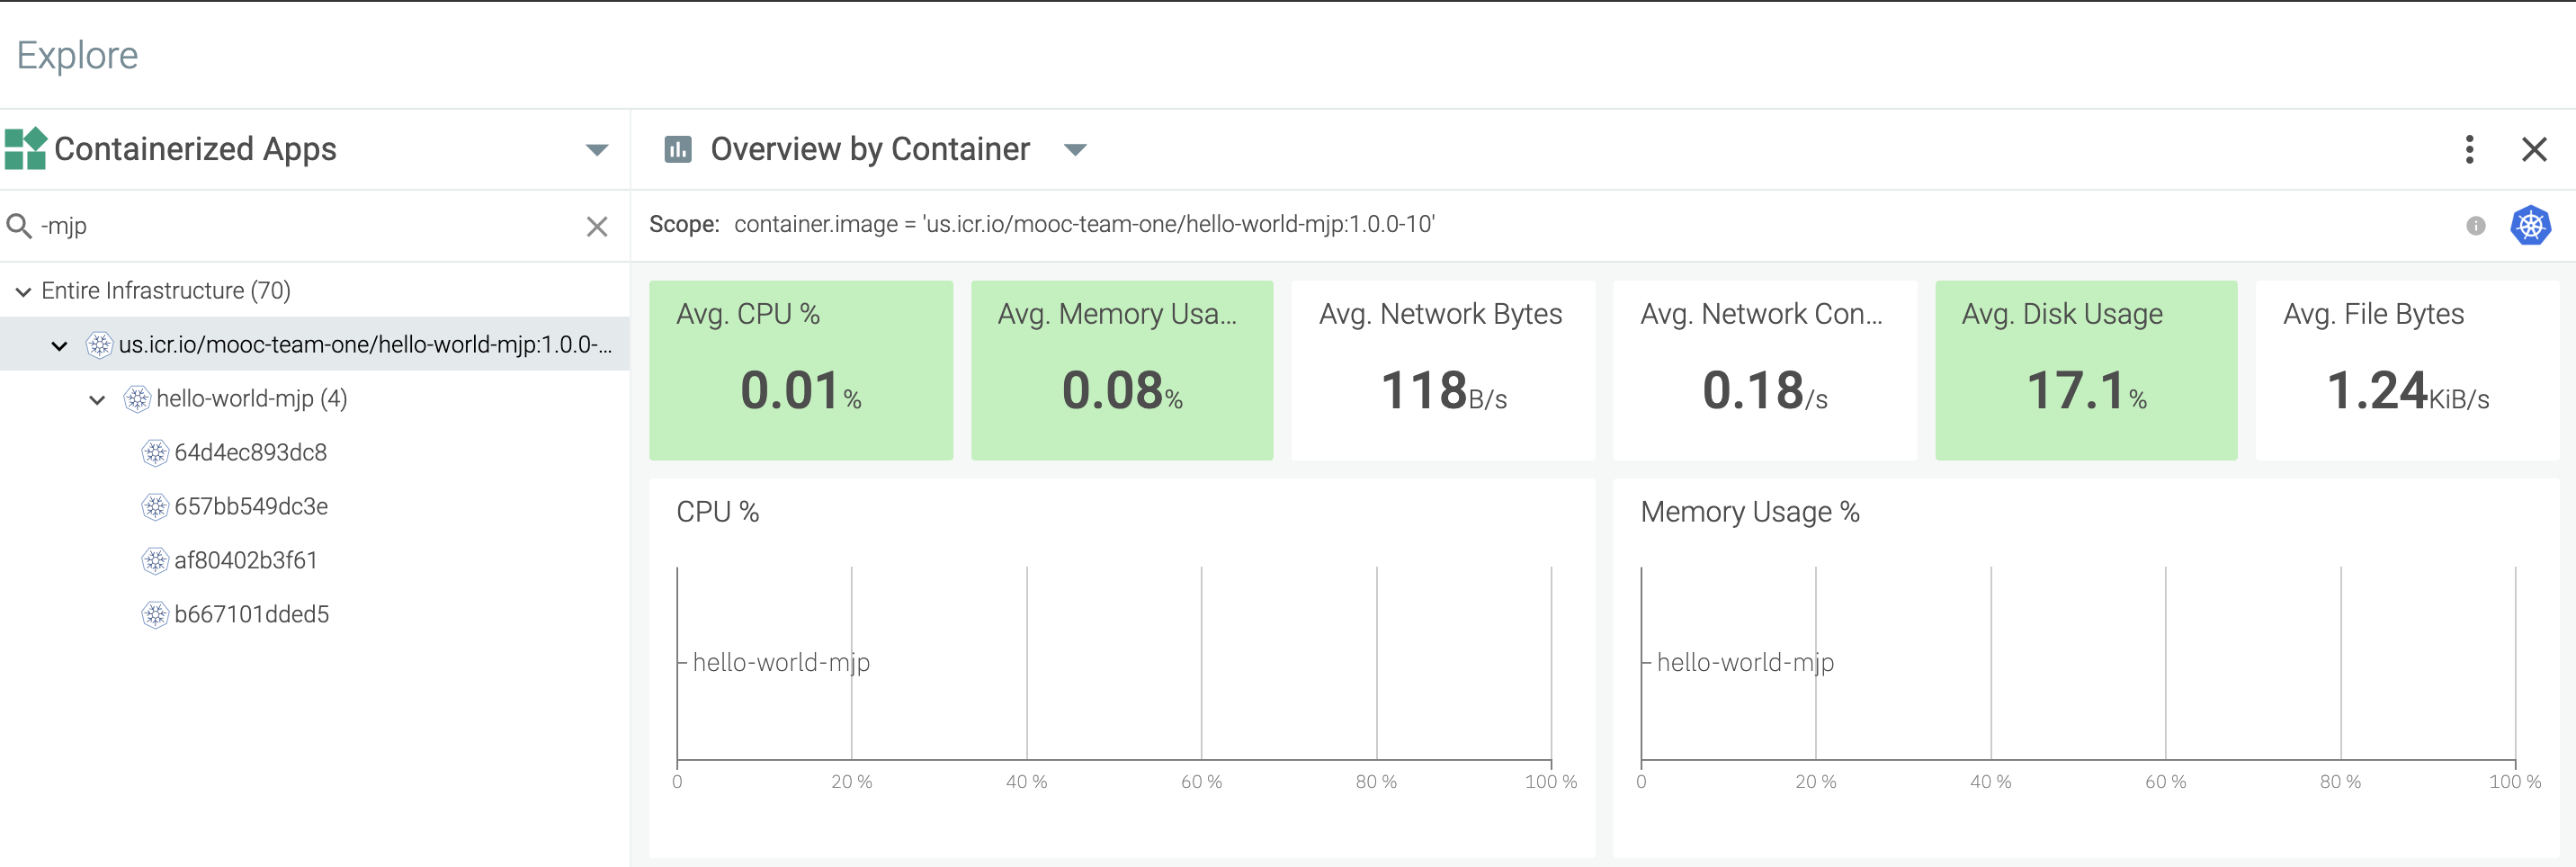
- On the Explore page, select the Containerized Apps grouping
- Search for your app, e.g.
hello-world-mjp - In the list of apps, select yours, e.g.
us.icr.io/mooc-team-one/hello-world-mjp:1.0.0-10 -
With your app selected, select Hosts & Containers > Overview by Container
The Overview by Container dashboard shows metrics for the containers in your app. You will now see just the metrics for your app. You can view at different levels--from pod to namespace to node to cluster--giving you a fine grain access to your monitoring requirements.
Conclusion
It's important to be able to monitor your deployed applications. Here, the
Learn more
Learn more about using SysDig Monitoring: